Soil MIR spectra
Introduction
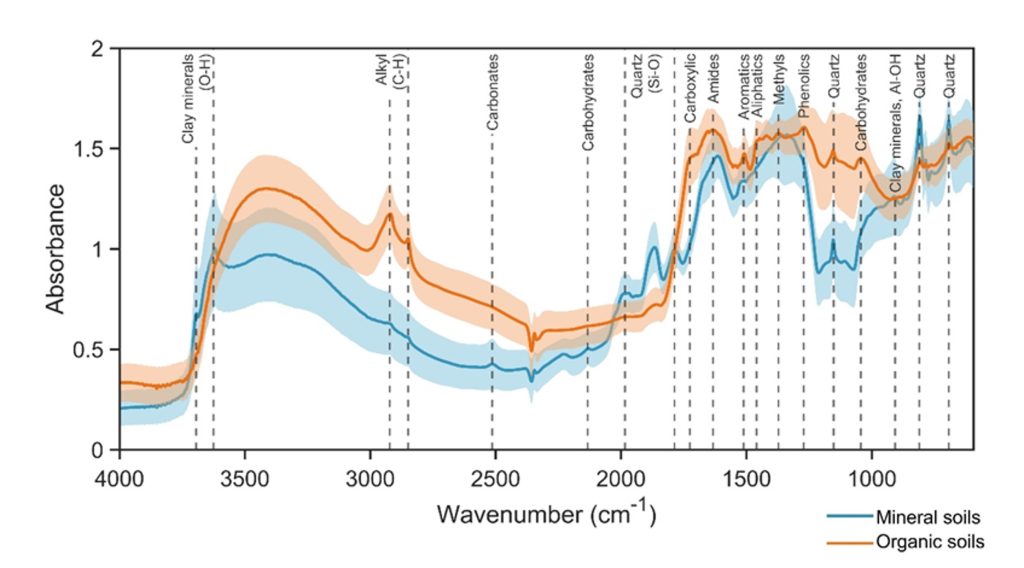
Soil mid-infrared (MIR) spectroscopy measures absorbance spectrum at 2,500 to 25,000 nm (4,000-400 cm-1) of the electromagnetic spectrum. The MIR absorption curve is generated by the fundamental vibrations of molecular bonds when a MIR radiation interacts with a soil sample. The absorption features are related to organic functional groups, clay minerals, quartz, and carbonates as shown in the figure below (Zhang et al., 2022).
KSSL soil MIR spectral library
The Kellogg Soil Survey Laboratory (KSSL) at the USDA Natural Resources Conservation Service – Soil and Plant Science Division (NRCS-SPSD) has recently developed a high-quality MIR spectral library and deployed MIR technologies to 15 field offices (and more to come) for collecting soil MIR spectra of local soils across the US.

Soil properties assessment
MIR spectroscopy techniques have been widely used to predict many soil physical (water content, particle size fractions, 1,500 kPa water), chemical (organic matter/carbon, total C, total N, minerals, cation exchange capacity, pH), and biological (C mineralization, N mineralization, microbial groups, enzymatic activities) properties with varied model performance.
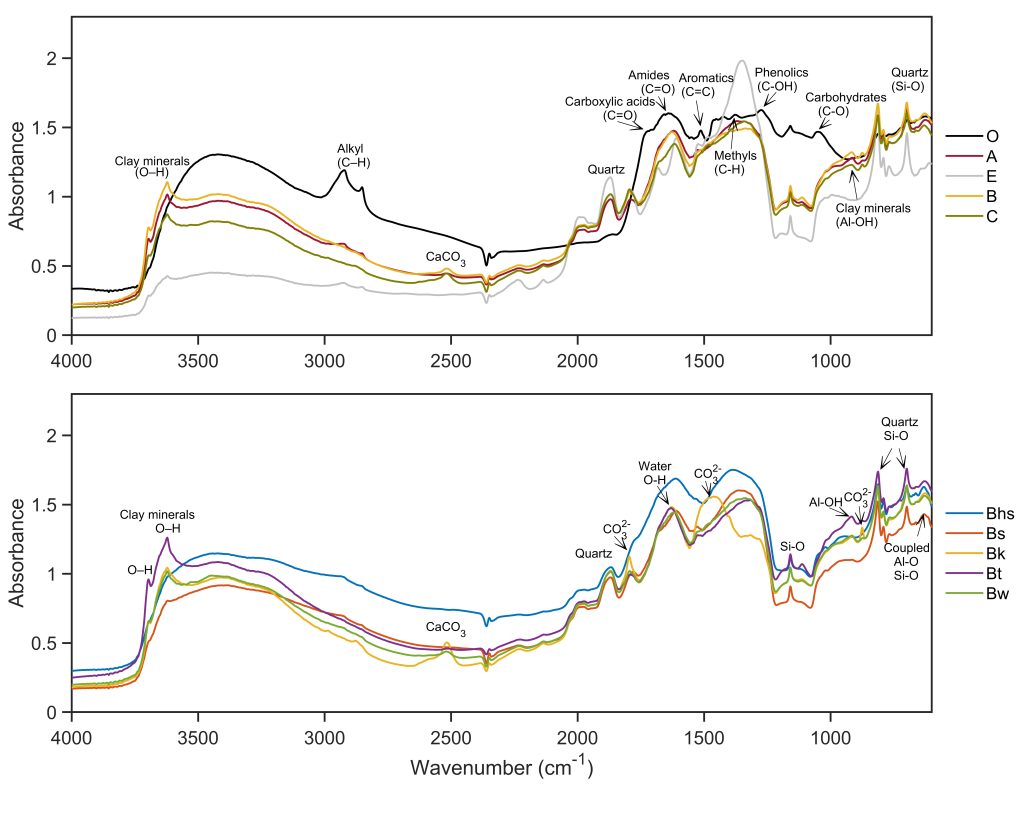
Soil classification
MIR spectroscopy techniques have also been used in soil classification, including identifying soil horizons and soil orders as shown below (Zhang et al., 2021).